


KENNESAW, Ga. | Sep 12, 2019

We are drowning in information and starving for knowledge.
– Rutherford D. Roger
Our Georgia economy is humming and is also inundated with all sorts of business data. 6 out of 10 largest payment companies reside here, processing 118 billion transactions annually with more than $72 billion annual revenue; UPS’s annual global delivery volume exceeds 5 billion packages and documents; Delta carries more than 150 million passengers each year; a typical Home Depot store stocks more than 30,000 items that need to be priced competitively and there are also more than 16 million active Home Depot consumer accounts that need to be managed properly. Businesses of smaller scale also accumulate data at an unprecedented speed. The availability of large amount of data has quickly changed the way business is conducted. Increasingly, business decision and development are relying on good data analysis, interpretation and forecast. These Fintech, logistic, transportation and retail companies create tens of thousands of jobs for students trained in Georgia universities. Most of the graduates at Coles College of Business will join these Georgia businesses not as a highly trained statistician or data scientist but as a salesperson, accountant, business analyst or consultant. Yet sooner or later in their professional career, they will be engaged in dealing with data: analyzing regional sales data, forecasting revenue, planning budget for multiple years, etc., all of which call for good data analysis skills. It is now a consensus among business school educators that good quantitative skills for data analysis lead to business knowledge discovery and give students a competitive edge in this digital age.
A more recent but less noticed trend in business school education is computer programming. Unlike subjects such as accounting or marketing, one rarely associates computer science with business education. As companies quickly integrate computer and software technology into business operation, executives and managers who have knowledge in computer science can certainly communicate better with engineers and tech-savvy clients. Leading business schools including Harvard, Wharton and NYU Stern have already started to include training in coding and computer science. This trend is further strengthened by aggressive push from the demand (employer) side. Citigroup recently decided to train all new analyst in Python (a popular programming language); Goldman Sachs traders are now expected to know programming; Earnest Young also launched programs to encourage employees to acquire knowledge in areas such as data visualization and artificial intelligence. It is clear that coding and computer science knowledge are gradually becoming a new part in business literacy.
Against the backdrop of recent trend in b-school curriculum, a dedicated course that connects computer programming with business analysis will likely fill the niche and add to the parfait of interesting courses offered by Coles. Dr. Xiao Huang, a Professor of Economics, recently developed an undergraduate and an MBA course that aim to improve students’ literacy in both programming and statistical analysis. The undergraduate special topic course Econ 4490 Computing Methods for Business Data introduces R programming and relevant econometric and statistical modeling methods for business data. Topics include general principles of programming, data visualization, computational linear algebra, Monte Carlo simulation, among others. The MBA special topic course Econ 8900 Statistics for Business Analysis is a more case-based study on using R for data modelling and visualization.
R is an open source statistical computing and graphic environment which has experienced significant growth in usage in recent years. It is free and well-maintained by a group of statisticians for constant improvement. It can be simply used as a calculator or to write programs for complicated statistical modeling and software package development. In teaching R, the use of Rstudio has made the learning experience quite pleasant. Rstudio is a cross-platform integrated development environment for R with friendly user interface and it simplifies file and software package management. A user can also seamlessly integrate programming, plotting and document preparation (word, power point, html, etc.) within Rstudio. In these courses, students learn how to prepare problem set solutions using Rstudio.
Just like statistical analysis, R programming itself is also a vast field to explore. The undergraduate course assumes students have no previous experience in computer programming and starts with the basics such as data storage, data input and output, and relational operators. The course later progresses to standard topics like flow control, writing functions, and debugging. Matrix-related concepts and operations are also introduced along with some Monte Carlo simulation techniques. The overall approach is to introduce R programming and demonstrate its usefulness in various statistical applications.
One thing that makes R so attractive in scientific research and business analysis is many computation methods and statistical procedures are made into packages that can be downloaded and installed on your computer for quick use. There are now more than 14,000 packages developed by diligent users in the R community, providing functions from simple data summary/regression to sophisticated machine learning algorithms. Here is one example to demonstrate R’s efficiency in implementing some high-level computation method. Parallel computing refers to simultaneous execution of multiple computation tasks. In many scientific research or business applications, dividing the computation into small jobs and spread them to multiple cores for execution may hugely improve efficiency. However, implementing parallel computing requires deep understanding in both computer hardware architecture and software development, likely an impossible mission for a business student with little background in computer science. Thanks to convenient packages in R, one can implement parallel computing using just a few lines of code. In the following sample code, we load two packages, foreach and doParallel, into the R session and request 4 cores for computation. The last two lines gives simple demonstration of executing a pre-defined function, task, 20 times, one using the parallel option and the other doesn’t.
| library(foreach) library(doParallel) registerDoParallel(cores = 4) system.time(foreach(i = 1:20) %dopar% task(400,5)) system.time(foreach(i = 1:20) %do% task(400,5)) |
# Load foreach package. # Load doParallel package. # Use 4 cores. # Use parallel computing. # Don't use. |
The output below shows that by using parallel computing option, the CPU time (elapsed) is reduced from 4.74 seconds to 2.39 seconds. The benefit can be quickly scaled up if one deploys R to a server with thousands of cores for more complicated computations.
## user system elapsed
## 0.02 0.00 2.40
## user system elapsed
## 4.61 0.01 4.63
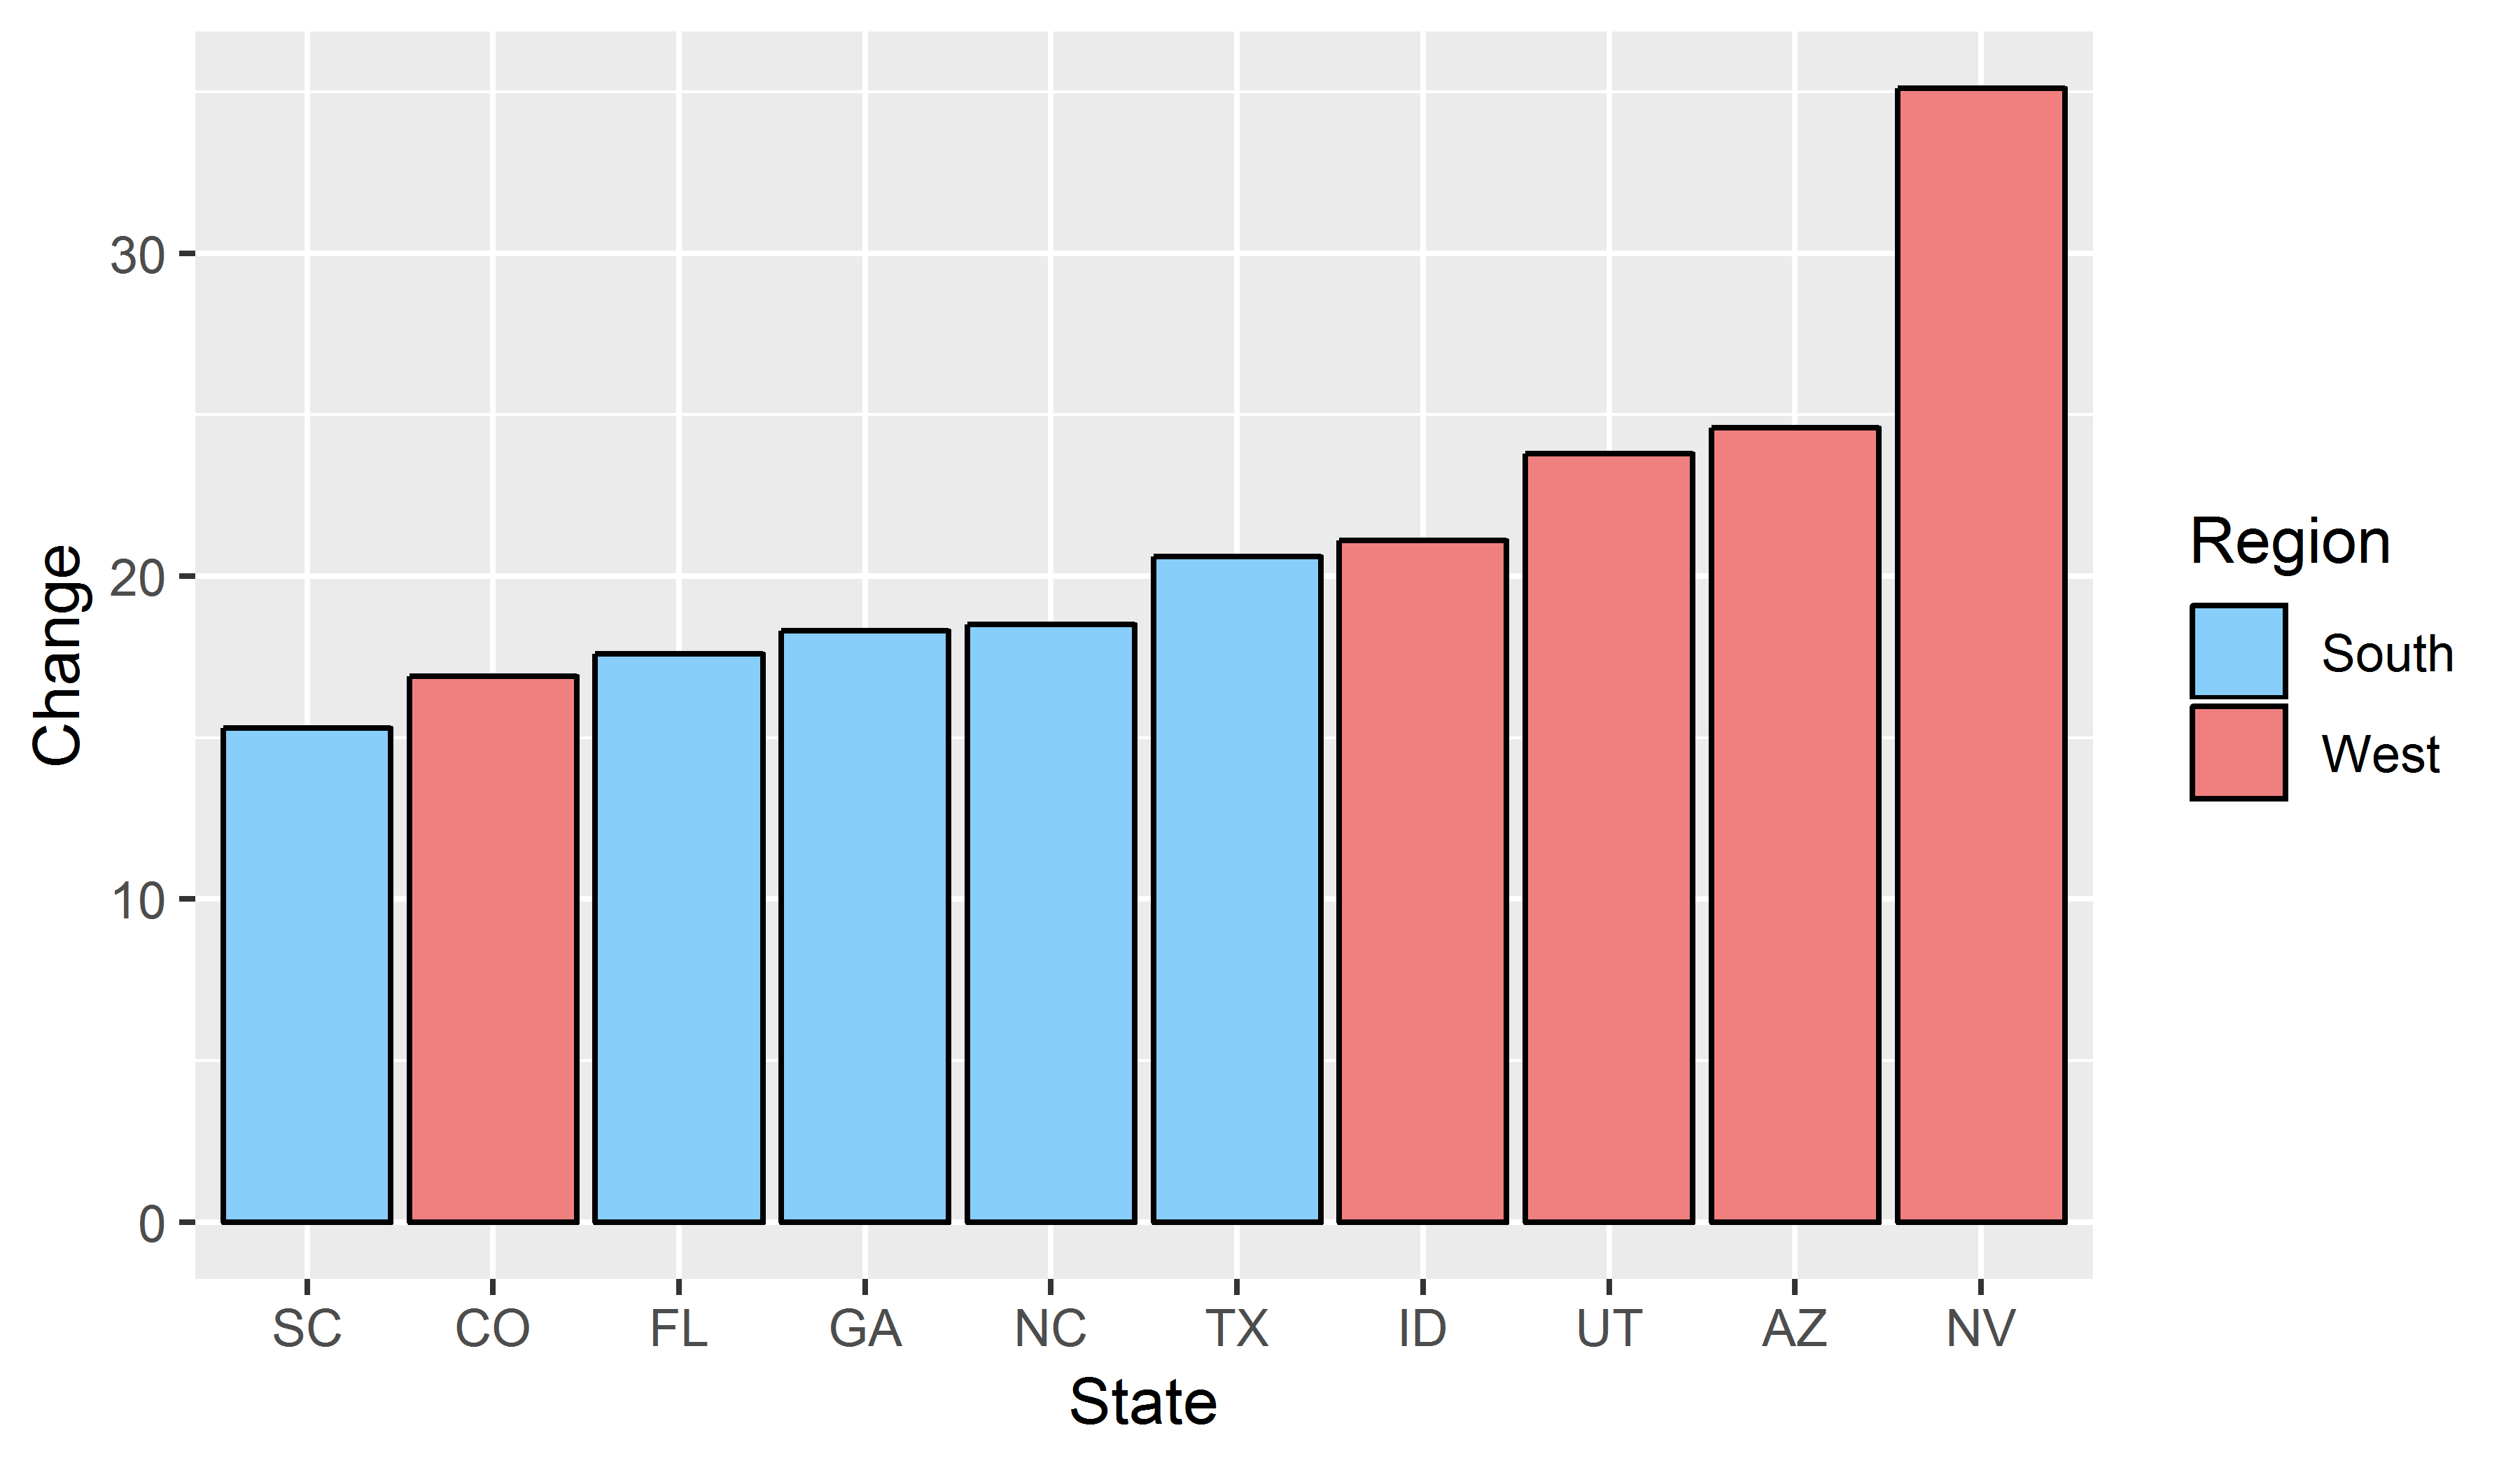
The undergraduate course also places great emphasis on students’ graphic technique training. We all know how to use Excel and Word to draw a graph and visualize data in basic tasks. R can do these basic things easily and the quality of the graphics is usually higher. Below is one example of bar plot to show the population growth (in percent) in several states from 2000 to 2010.
Graphs for the familiar topic of linear regression can also be done in R straightforwardly. Here is one example of both linear and nonlinear modeling on the relationship between height and age variables.
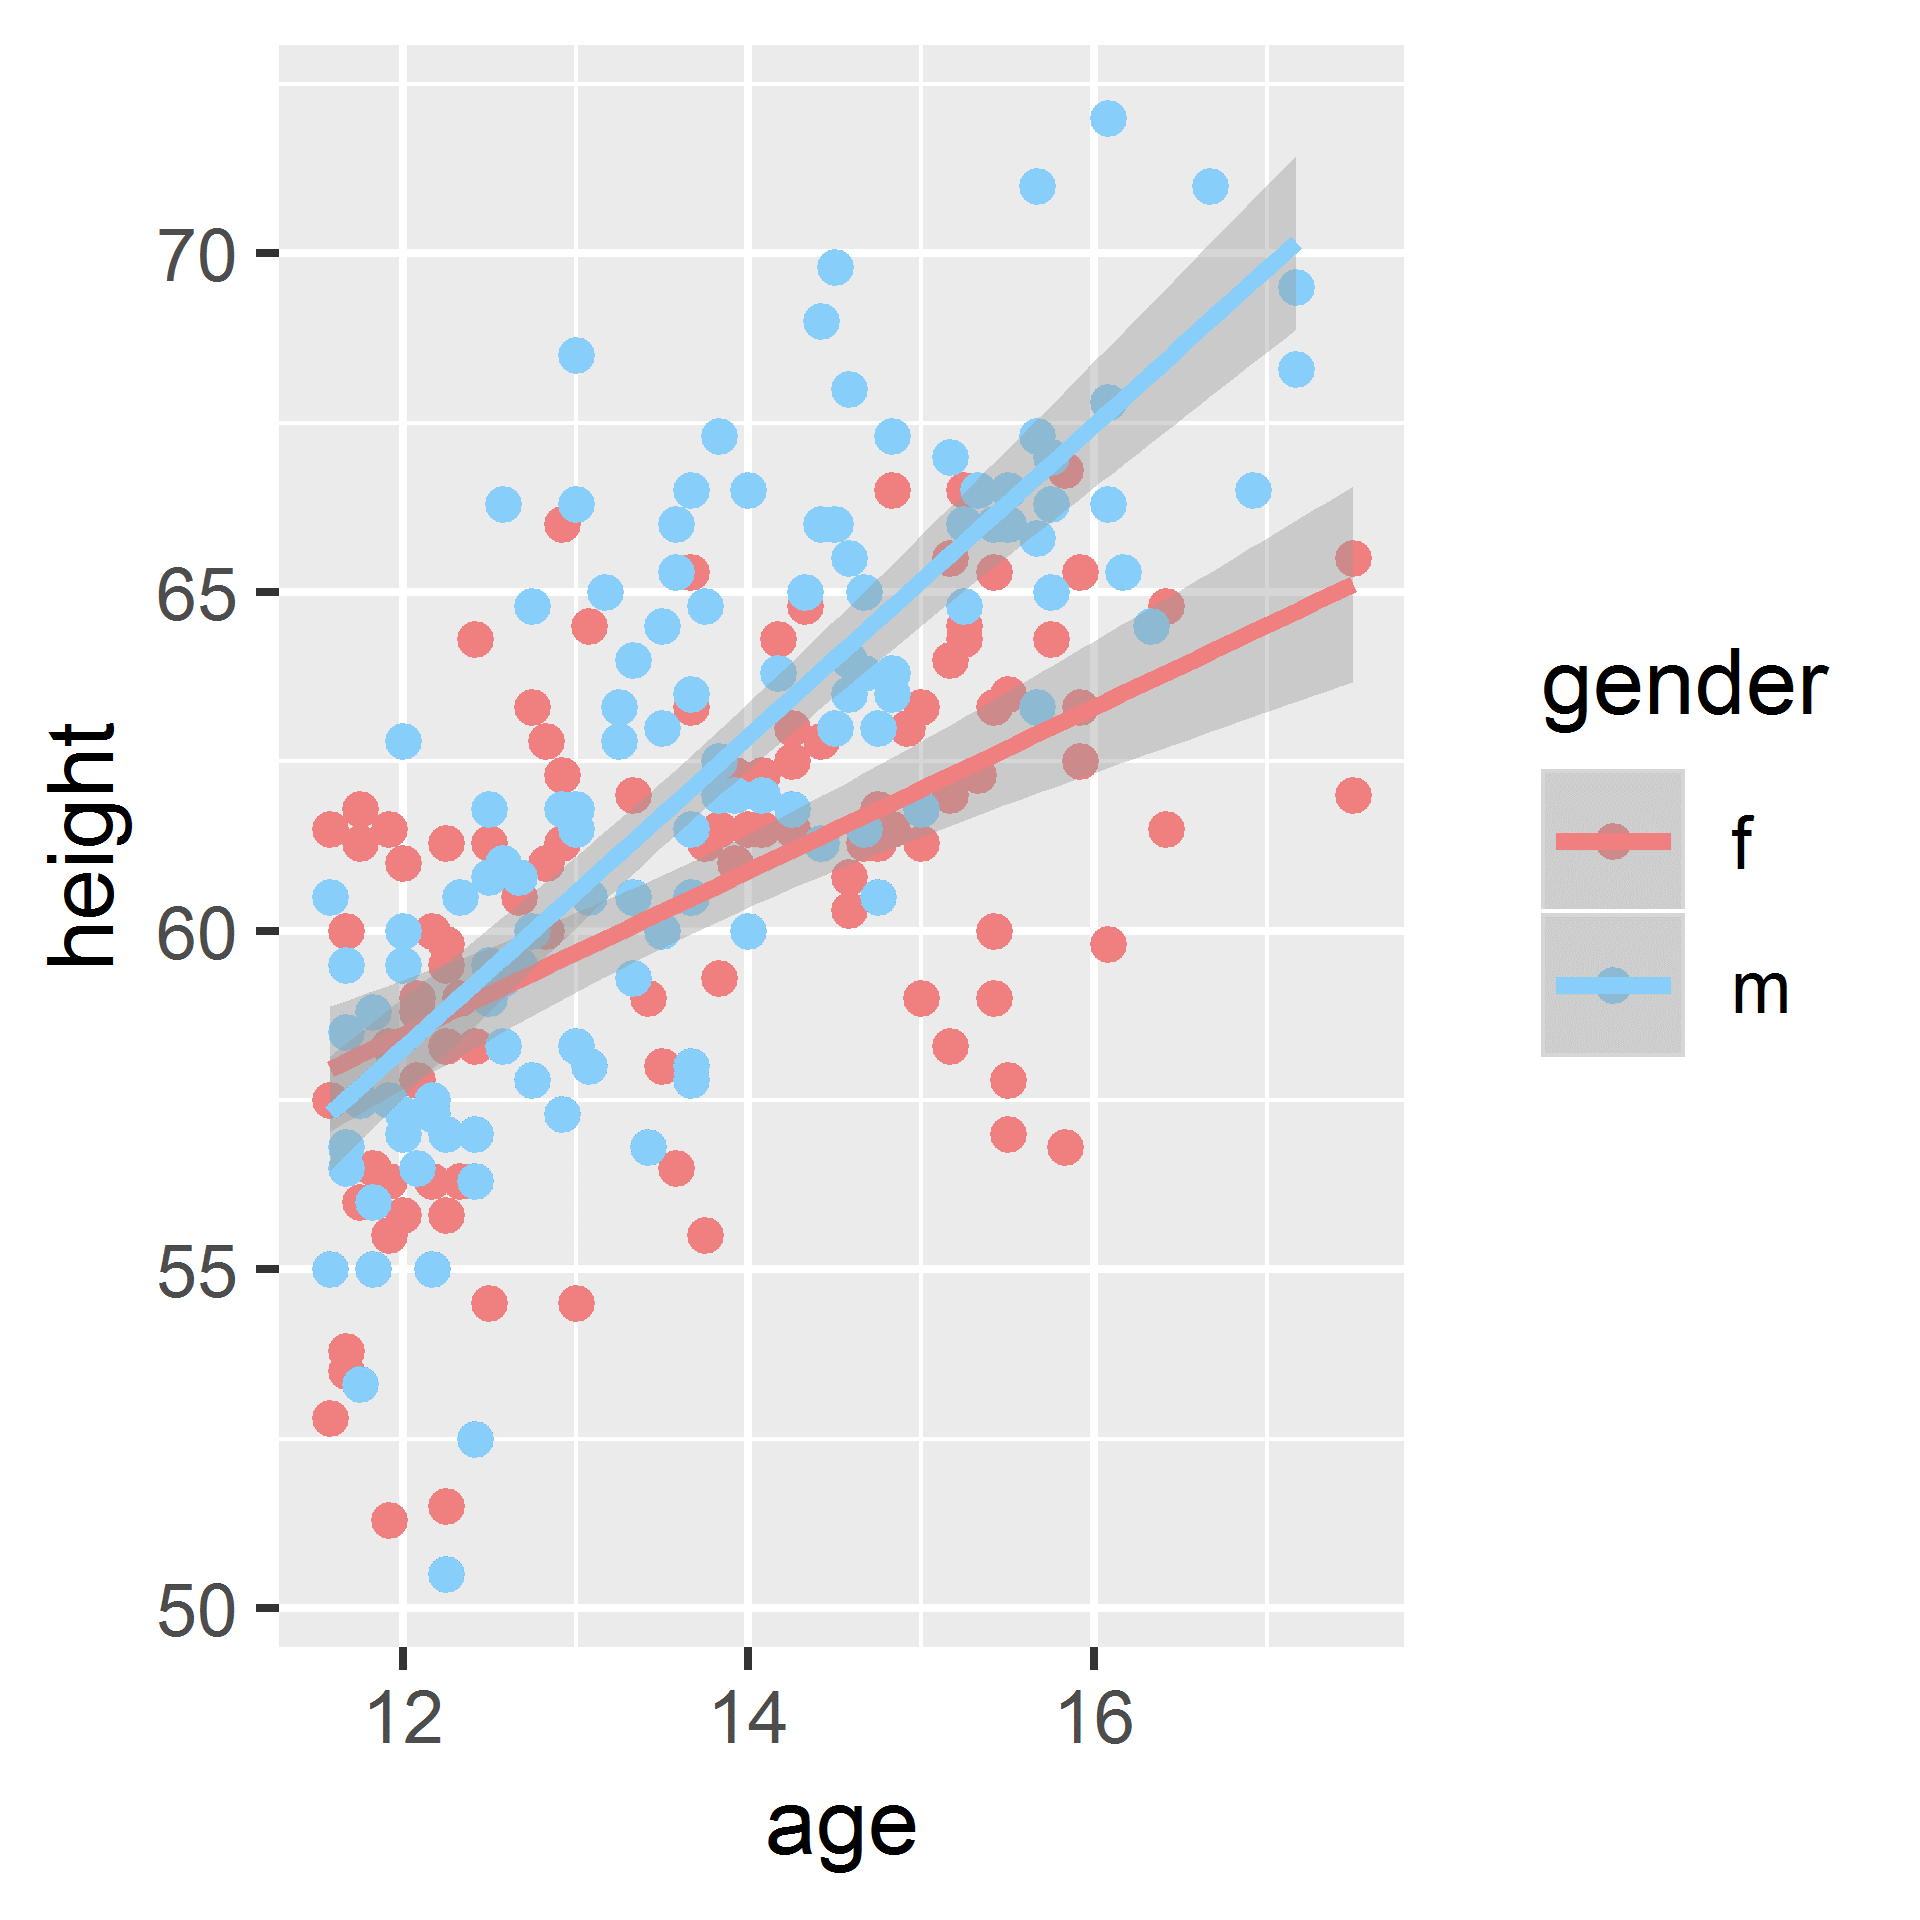 |
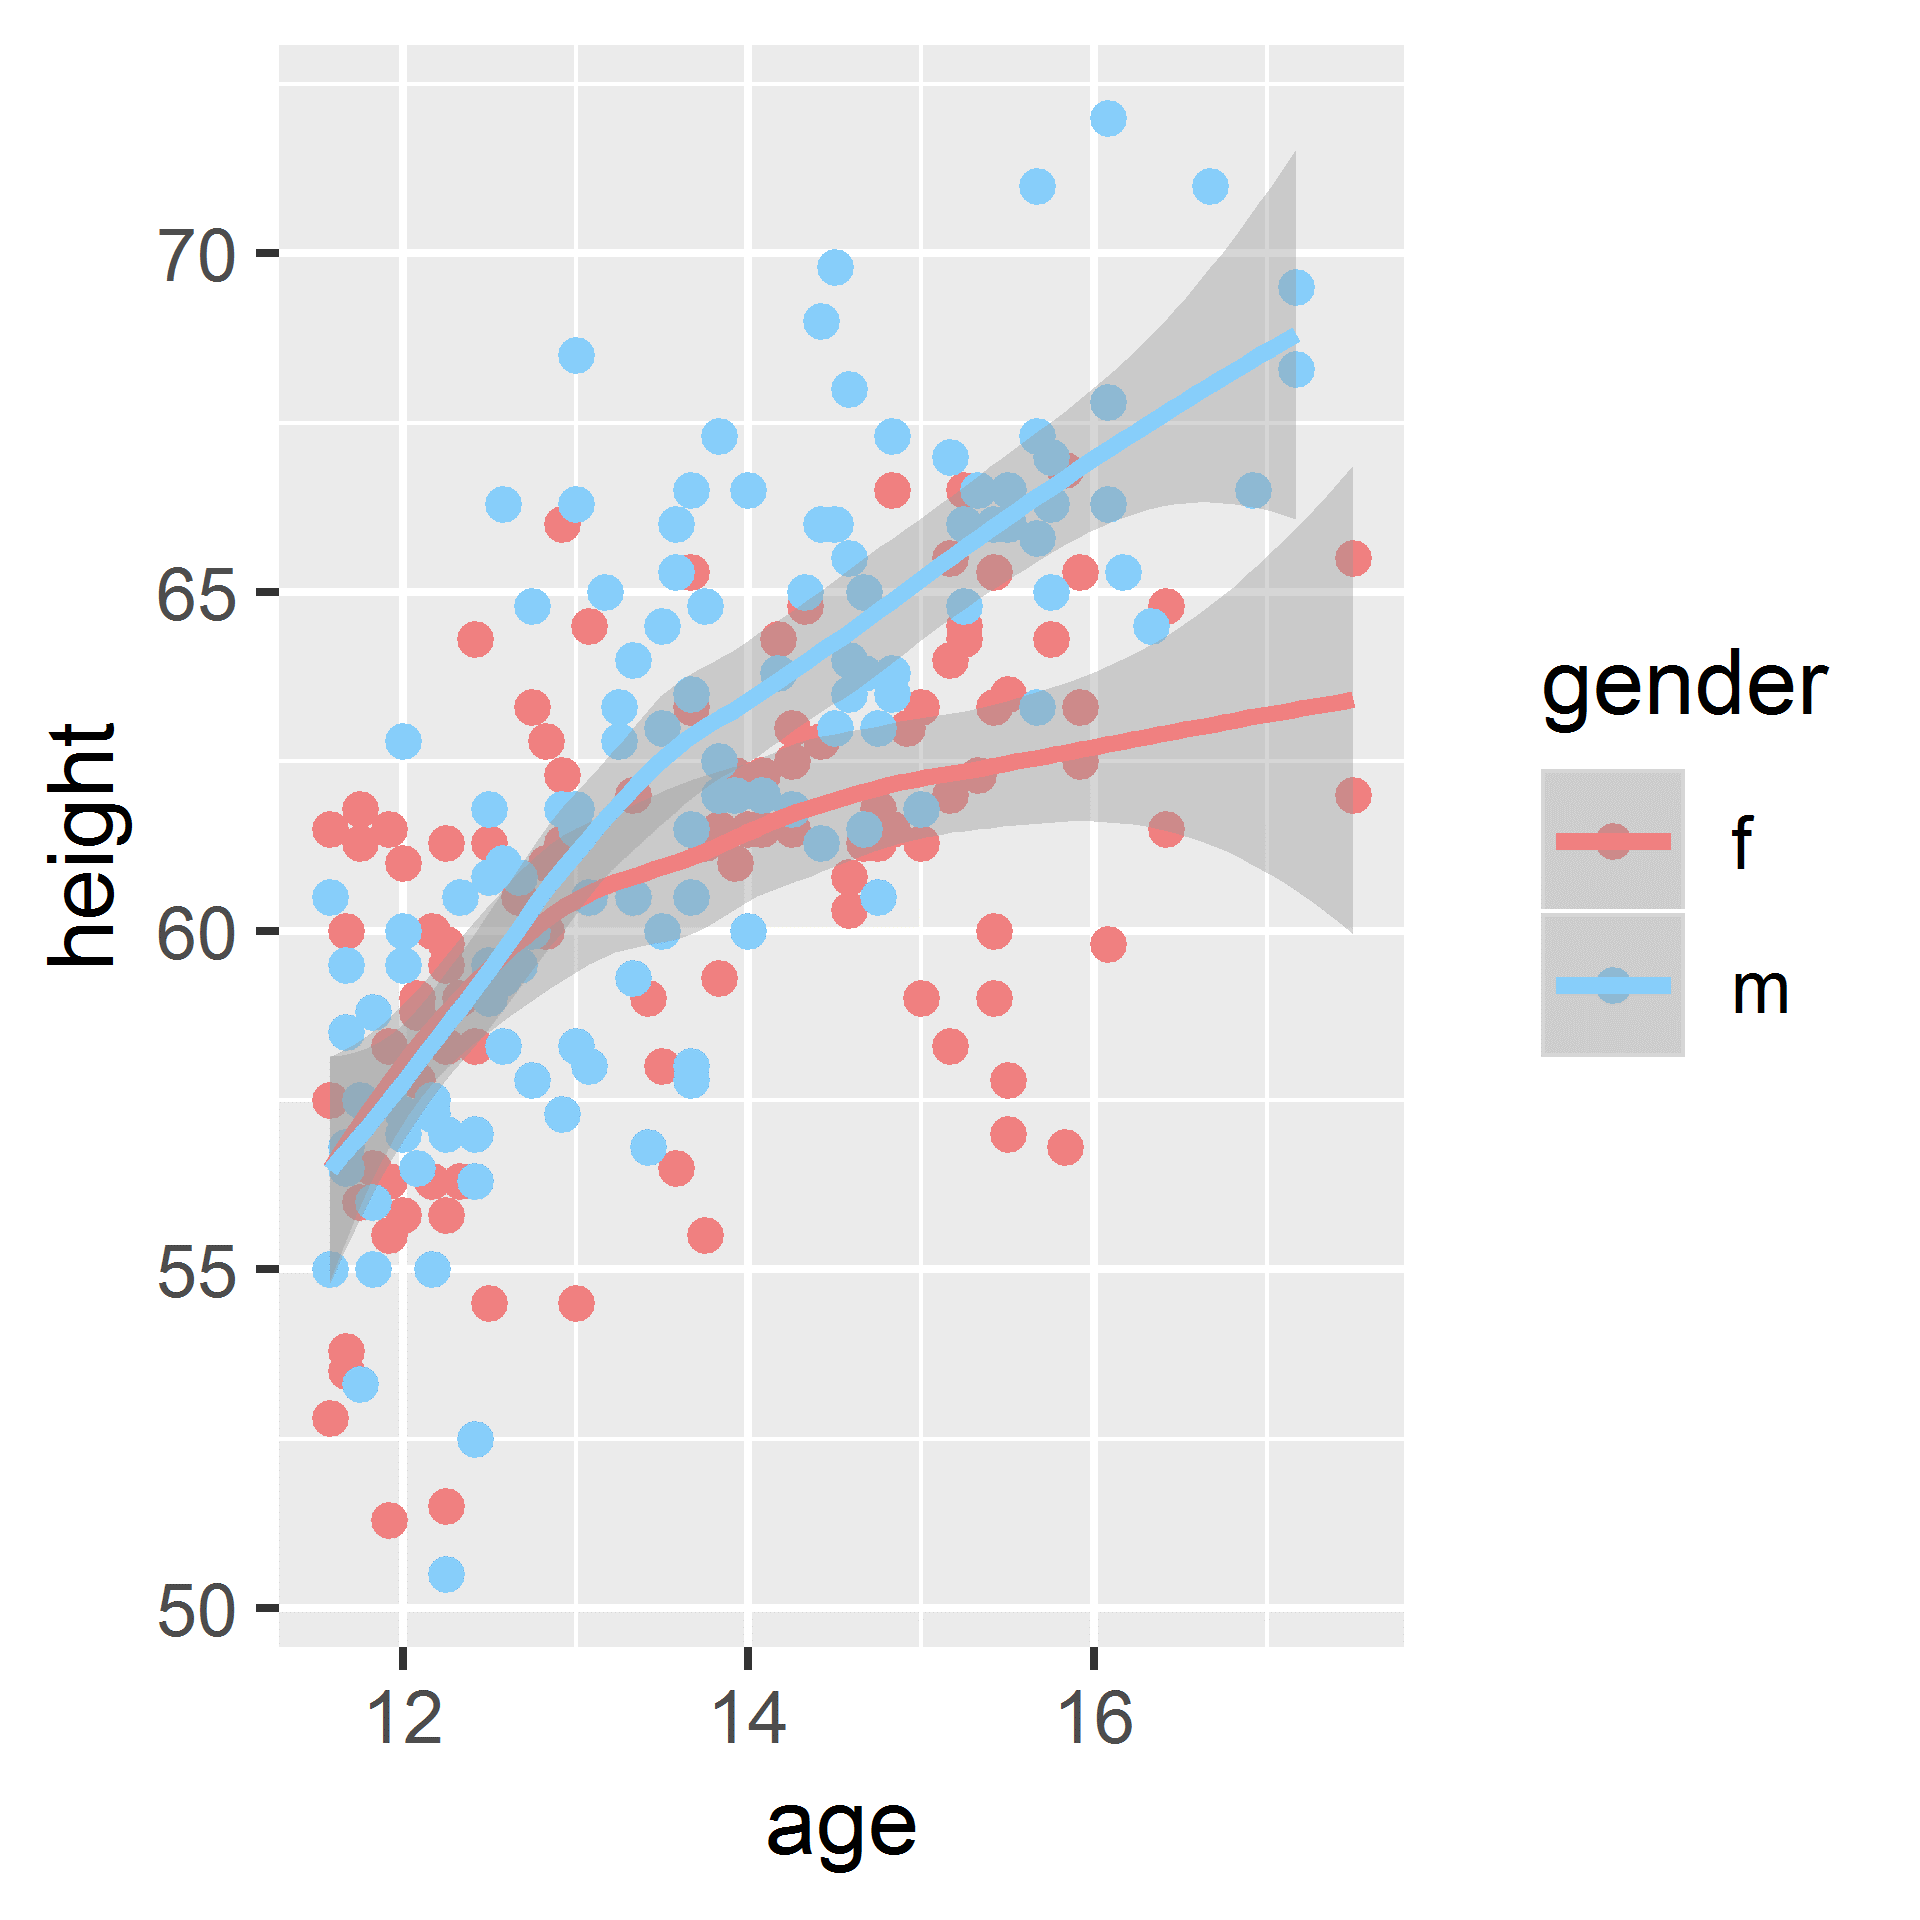 |
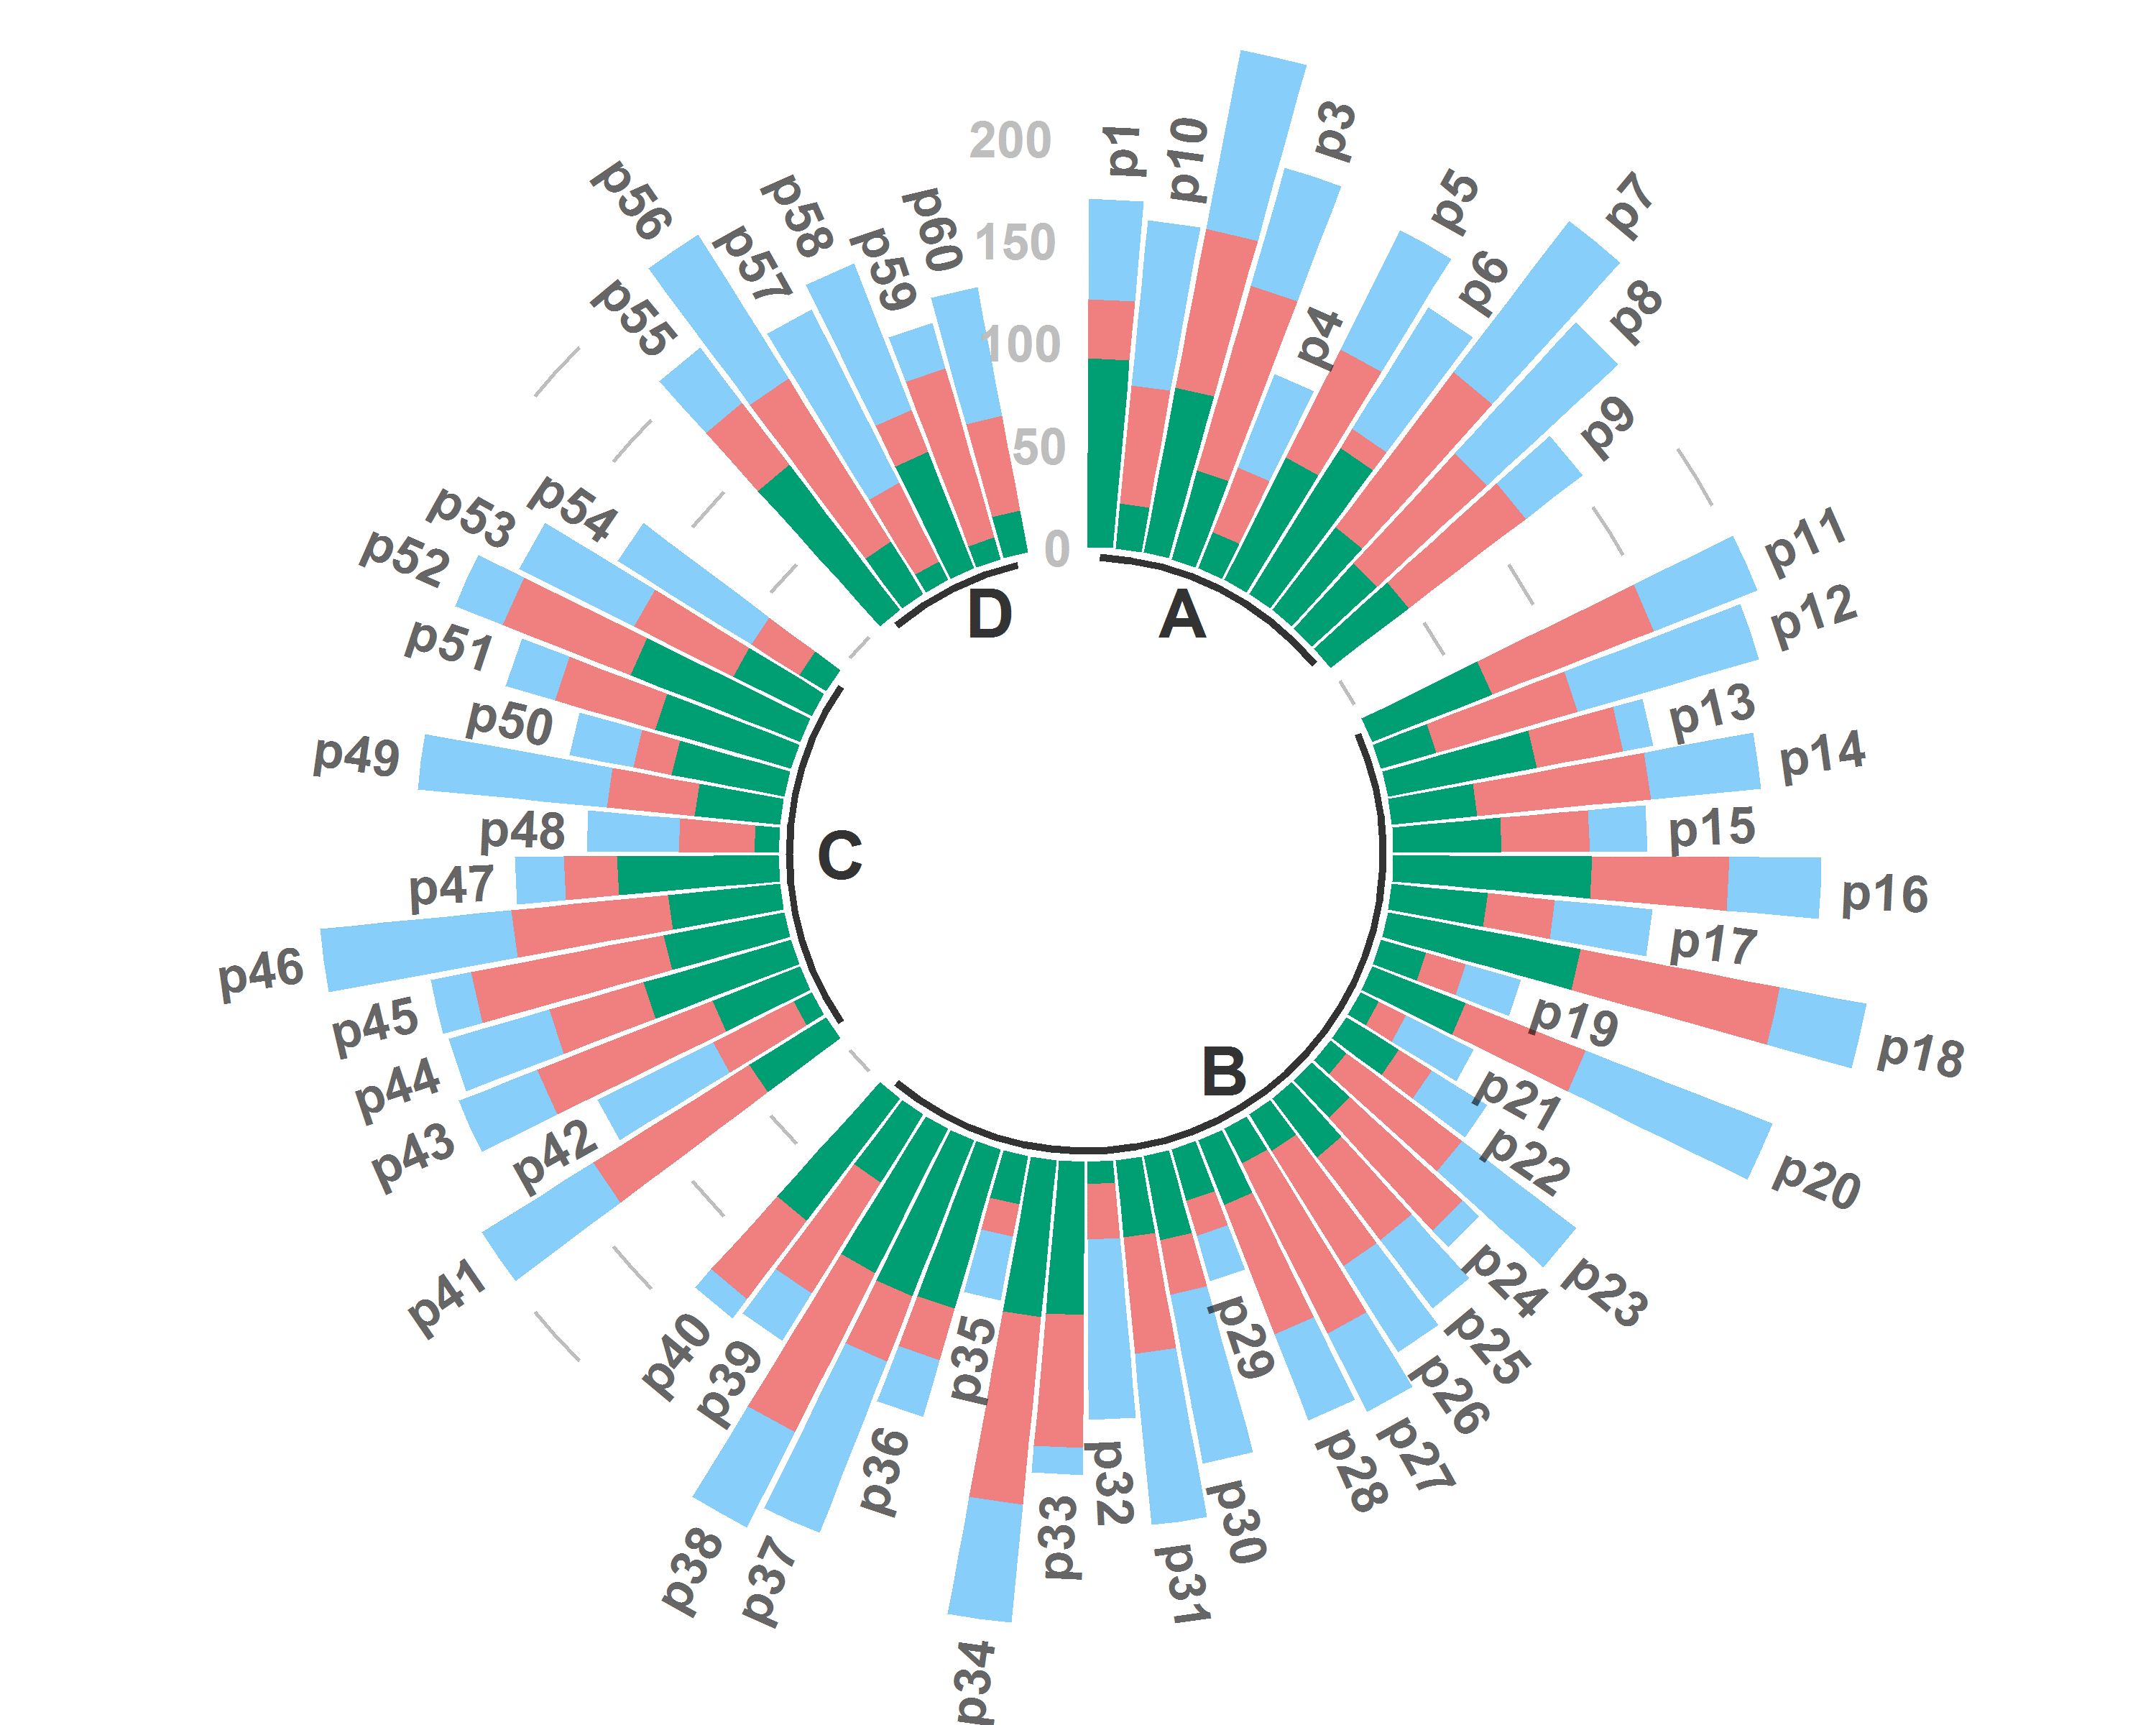
R provides a flexibility unmatched by Excel or Word when it comes to more complicated statistical graphs. Imagine a company has 4 product categories (A/B/C/D) with a total of 60 different products in 3 sales regions that are colored differently. A circular stacked bar plot can visualize the sales of all products in different regions in one graph. It will be difficult to reproduce the same graph using either Excel or Word.
Another example relates to a case in the MBA course where flight data from the Bureau of Transportation Statistics website are used for business case study. To see the graphic capability of R, the following graph uses the latest on-time flight data in June 2019 to illustrate Delta’s domestic direct flights originated from Atlanta, excluding direct flight to Hawaii to control the map size.
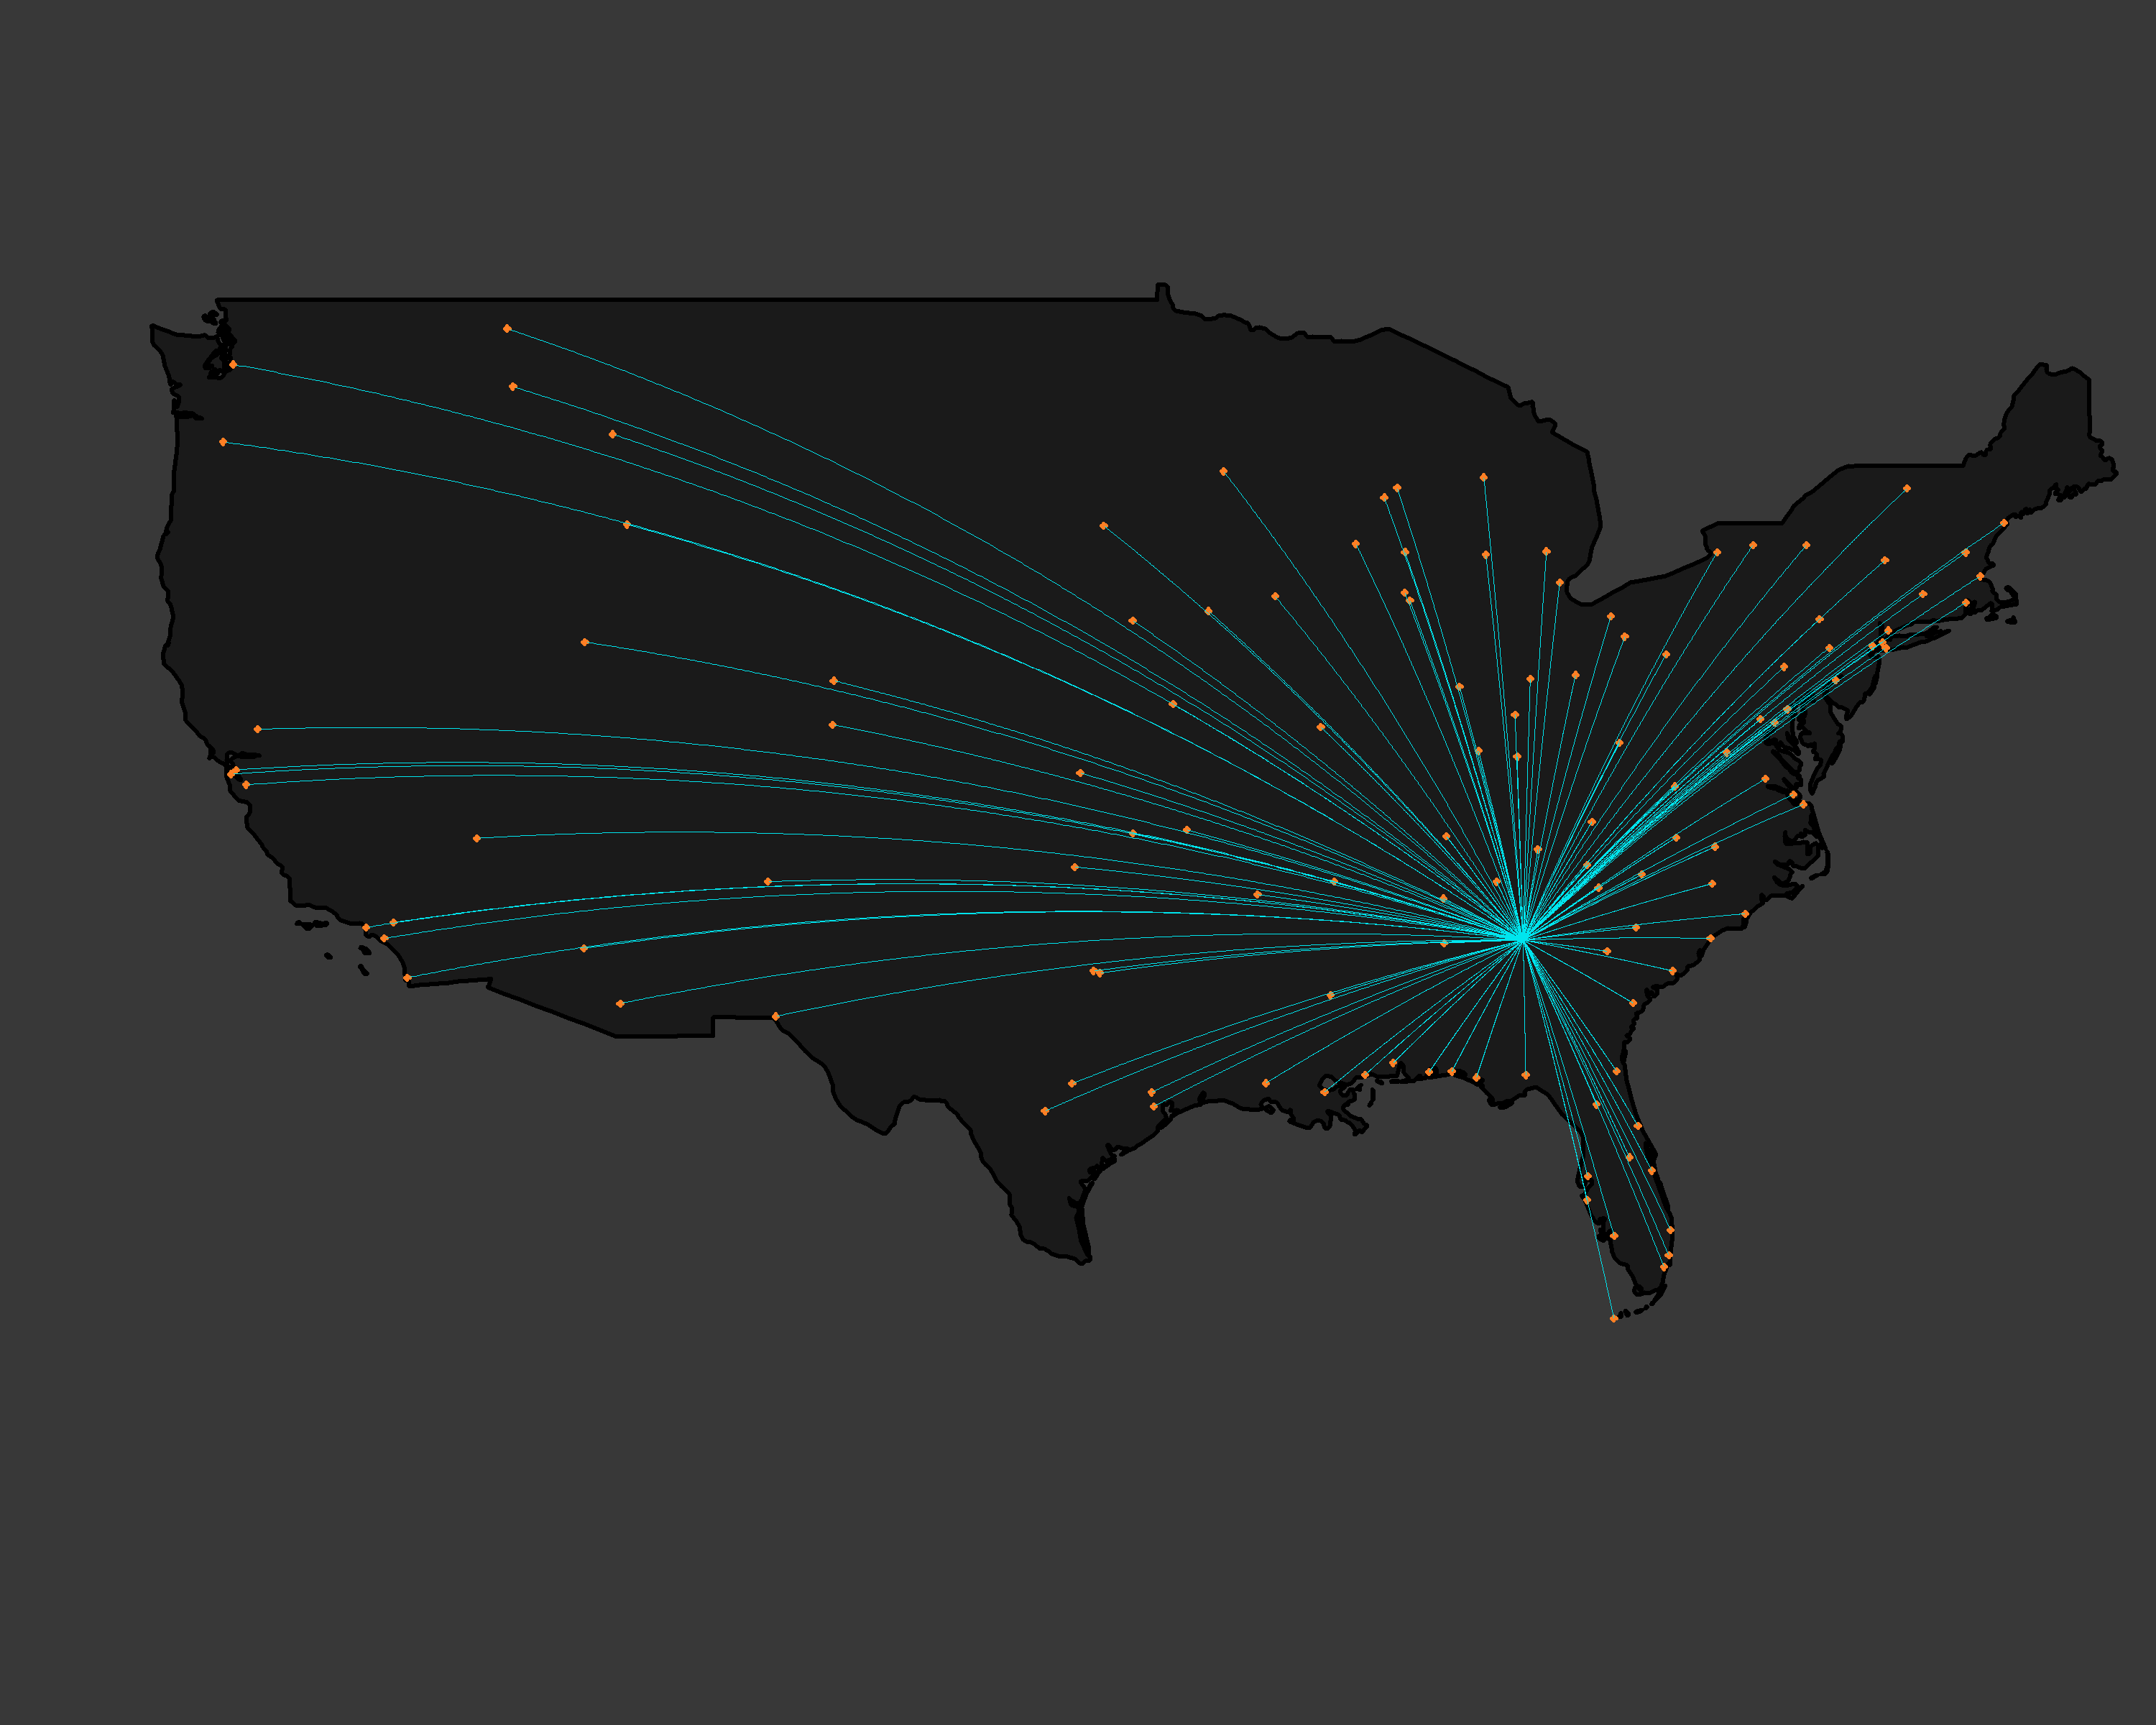
In both examples, a user can take advantage of R’s flexible graphic functions to produced highly customized statistical graphs.
The landscape of business education is constantly changing. Offering these two new courses reflects our continuous effort to improve curriculum and to better serve our students at Coles College of Business. When more and more businesses are driven by data-based knowledge discovery, it is our belief that a student equipped with good quantitative and programming skills is more competitive and can explore wider career options.

Bringing Career Conversations Into the (Virtual) Classroom: Requiring One-On-One Office Hours in an Online Marketing Capstone for Student Success
How does Services Development Affect Manufacturing Export Competitiveness?
The Problem of Teaching Performance Evaluation and a Proposed Solution
Disruption at Regional Universities: Challenges and Opportunities.

